


Texas results by county
Every county that has finished counting (95% or more), with its 2026 margin and the change from the 2024 presidential vote in the same county.
Texas Senate
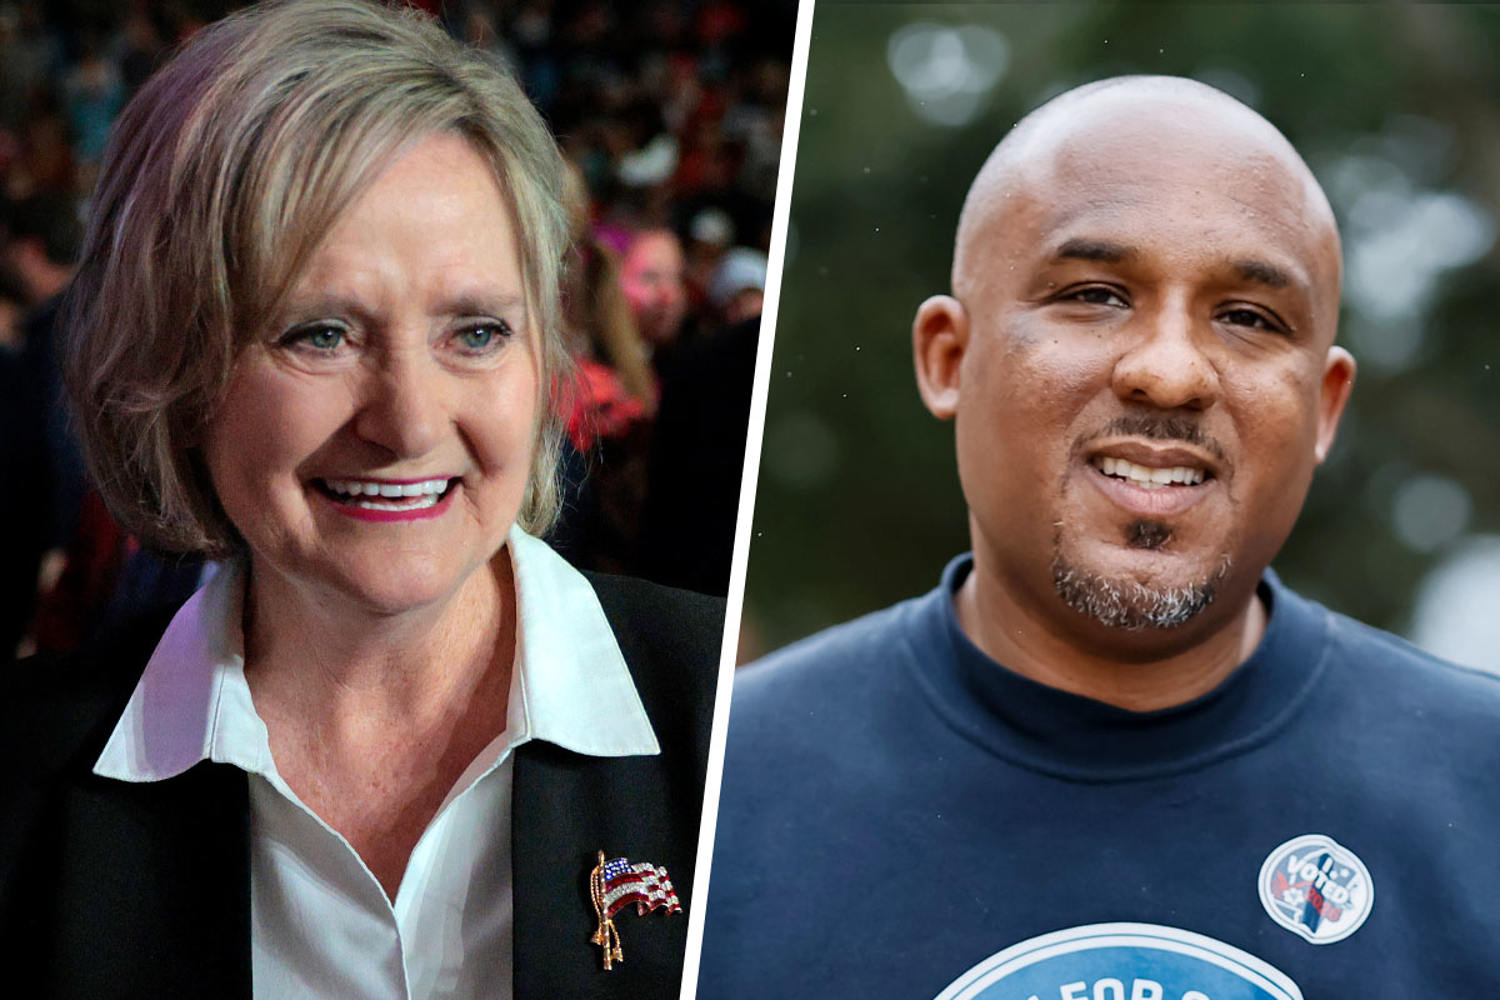
James Talarico won (54.0%).
79 of 254 counties counted. Together, those counties moved toward D 21.9 points from 2024.
| County | Votes | 2026 | 2024 | Swing |
|---|---|---|---|---|
| Austin | 12,819 | R+46.1 | R+62.7 | D+16.6 |
| Bastrop | 36,976 | D+10.9 | R+18.4 | D+29.3 |
| Bell | 110,495 | D+5.1 | R+16.2 | D+21.4 |
| Bexar | 658,445 | D+35.5 | D+9.7 | D+25.7 |
| Blanco | 7,557 | R+41.7 | R+52.5 | D+10.9 |
| Borden | 306 | R+83.3 | R+91.5 | D+8.1 |
| Brazoria | 141,824 | D+5.4 | R+19.7 | D+25.1 |
| Brazos | 79,867 | D+6.0 | R+24.9 | D+30.8 |
| Burleson | 7,799 | R+48.2 | R+62.8 | D+14.6 |
| Burnet | 24,246 | R+38.9 | R+55.7 | D+16.8 |
| Caldwell | 14,781 | D+15.7 | R+14.4 | D+30.1 |
| Cameron | 102,017 | D+38.5 | R+5.8 | D+44.3 |
| Chambers | 19,453 | R+45.9 | R+65.6 | D+19.7 |
| Cochran | 694 | R+36.0 | R+65.7 | D+29.7 |
| Collin | 457,413 | D+12.1 | R+11.1 | D+23.2 |
| Colorado | 8,353 | R+43.3 | R+57.2 | D+13.9 |
| Comal | 89,097 | R+29.2 | R+45.5 | D+16.3 |
| Cooke | 17,142 | R+49.3 | R+66.9 | D+17.6 |
| Cottle | 535 | R+60.4 | R+72.5 | D+12.1 |
| Culberson | 867 | D+22.1 | R+16.9 | D+39.0 |
| Dallas | 888,831 | D+20.0 | D+22.2 | R+2.2 |
| Denton | 395,959 | D+8.4 | R+13.2 | D+21.6 |
| Edwards | 805 | R+56.0 | R+73.2 | D+17.2 |
| Ellis | 88,524 | R+4.4 | R+31.1 | D+26.6 |
| Fayette | 11,183 | R+45.1 | R+61.4 | D+16.3 |
| Fort Bend | 331,728 | D+28.6 | D+1.6 | D+27.0 |
| Galveston | 134,555 | R+5.9 | R+27.4 | D+21.5 |
| Gillespie | 14,747 | R+46.6 | R+60.9 | D+14.4 |
| Glasscock | 557 | R+78.8 | R+88.2 | D+9.4 |
| Goliad | 3,350 | R+47.0 | R+60.2 | D+13.3 |
| Gonzales | 6,689 | R+31.0 | R+54.8 | D+23.8 |
| Grayson | 53,782 | R+37.4 | R+54.3 | D+16.8 |
| Grimes | 11,718 | R+43.8 | R+60.3 | D+16.4 |
| Guadalupe | 95,995 | R+30.6 | R+29.5 | R+1.1 |
| Harris | 1,382,875 | D+33.0 | D+5.5 | D+27.4 |
| Hays | 119,693 | D+32.1 | D+5.6 | D+26.4 |
| Hidalgo | 202,520 | D+46.5 | R+2.9 | D+49.3 |
| Hood | 30,225 | R+52.4 | R+66.0 | D+13.6 |
| Hunt | 37,502 | R+33.9 | R+55.5 | D+21.6 |
| Jack | 3,392 | R+68.8 | R+82.3 | D+13.5 |
| Johnson | 69,924 | R+27.2 | R+51.4 | D+24.3 |
| Kaufman | 62,251 | D+1.3 | R+27.9 | D+29.1 |
| Kendall | 26,064 | R+43.2 | R+55.7 | D+12.5 |
| Kenedy | 159 | R+11.9 | R+46.8 | D+34.9 |
| Kent | 368 | R+63.3 | R+76.4 | D+13.1 |
| King | 116 | R+84.5 | R+91.1 | D+6.6 |
| Kinney | 1,229 | R+28.7 | R+50.5 | D+21.8 |
| Lampasas | 9,161 | R+43.8 | R+59.6 | D+15.7 |
| Lee | 6,921 | R+42.5 | R+60.4 | D+18.0 |
| Liberty | 25,449 | R+28.1 | R+61.6 | D+33.5 |
| Llano | 11,665 | R+49.8 | R+60.9 | D+11.0 |
| Loving | 67 | R+61.2 | R+78.4 | D+17.2 |
| Lubbock | 104,328 | R+16.5 | R+39.5 | D+23.0 |
| Lynn | 2,122 | R+55.7 | R+70.3 | D+14.6 |
| Mason | 2,158 | R+52.2 | R+65.0 | D+12.8 |
| Maverick | 12,551 | D+41.1 | R+18.5 | D+59.6 |
| McMullen | 371 | R+72.2 | R+84.4 | D+12.2 |
| Medina | 21,237 | R+21.8 | R+42.7 | D+20.9 |
| Montgomery | 258,438 | R+22.2 | R+45.5 | D+23.2 |
| Parker | 76,140 | R+50.9 | R+66.4 | D+15.5 |
| Presidio | 1,878 | D+54.8 | D+30.2 | D+24.6 |
| Real | 1,505 | R+56.5 | R+66.9 | D+10.4 |
| Reeves | 3,099 | D+7.7 | R+36.9 | D+44.6 |
| Roberts | 453 | R+84.8 | R+92.5 | D+7.7 |
| Robertson | 6,973 | R+32.5 | R+52.1 | D+19.6 |
| Rockwall | 53,505 | R+22.5 | R+40.9 | D+18.4 |
| Smith | 88,960 | R+24.6 | R+45.1 | D+20.5 |
| Somervell | 4,302 | R+57.4 | R+70.8 | D+13.4 |
| Tarrant | 728,259 | D+19.2 | R+5.1 | D+24.4 |
| Titus | 8,735 | R+24.8 | R+54.7 | D+29.9 |
| Travis | 548,521 | D+58.5 | D+39.3 | D+19.2 |
| Uvalde | 8,348 | R+2.4 | R+33.4 | D+31.0 |
| Waller | 23,751 | R+1.8 | R+25.0 | D+23.2 |
| Washington | 15,480 | R+41.4 | R+54.7 | D+13.3 |
| Webb | 58,349 | D+47.3 | R+2.2 | D+49.5 |
| Williamson | 278,482 | D+20.3 | R+2.4 | D+22.8 |
| Wilson | 21,988 | R+35.6 | R+53.7 | D+18.2 |
| Wise | 30,972 | R+52.3 | R+70.0 | D+17.8 |
| Zavala | 3,078 | D+50.6 | D+14.4 | D+36.2 |
Texas Governor
Gina Hinojosa won (52.8%).
79 of 254 counties counted. Together, those counties moved toward D 19.8 points from 2024.
| County | Votes | 2026 | 2024 | Swing |
|---|---|---|---|---|
| Austin | 12,858 | R+49.1 | R+62.7 | D+13.6 |
| Bastrop | 37,093 | D+5.4 | R+18.4 | D+23.8 |
| Bell | 110,831 | R+0.6 | R+16.2 | D+15.6 |
| Bexar | 659,522 | D+31.0 | D+9.7 | D+21.2 |
| Blanco | 7,599 | R+45.7 | R+52.5 | D+6.8 |
| Borden | 308 | R+87.7 | R+91.5 | D+3.8 |
| Brazoria | 141,901 | D+1.7 | R+19.7 | D+21.4 |
| Brazos | 79,997 | D+0.7 | R+24.9 | D+25.6 |
| Burleson | 7,813 | R+52.8 | R+62.8 | D+10.0 |
| Burnet | 24,362 | R+43.7 | R+55.7 | D+12.0 |
| Caldwell | 14,831 | D+11.4 | R+14.4 | D+25.8 |
| Cameron | 102,690 | D+34.6 | R+5.8 | D+40.4 |
| Chambers | 19,472 | R+48.3 | R+65.6 | D+17.2 |
| Collin | 458,423 | D+4.5 | R+11.1 | D+15.6 |
| Colorado | 8,382 | R+46.4 | R+57.2 | D+10.8 |
| Comal | 89,162 | R+33.5 | R+45.5 | D+12.0 |
| Cooke | 17,218 | R+54.4 | R+66.9 | D+12.5 |
| Cottle | 542 | R+62.5 | R+72.5 | D+9.9 |
| Culberson | 891 | D+16.0 | R+16.9 | D+33.0 |
| Dallas | 784,122 | D+39.3 | D+22.2 | D+17.1 |
| Denton | 396,752 | D+2.0 | R+13.2 | D+15.2 |
| Edwards | 815 | R+61.1 | R+73.2 | D+12.1 |
| Ellis | 88,686 | R+8.3 | R+31.1 | D+22.8 |
| Fayette | 11,270 | R+50.0 | R+61.4 | D+11.4 |
| Fort Bend | 331,421 | D+22.6 | D+1.6 | D+21.0 |
| Galveston | 134,628 | R+9.7 | R+27.4 | D+17.7 |
| Gillespie | 14,634 | R+52.0 | R+60.9 | D+8.9 |
| Glasscock | 559 | R+80.9 | R+88.2 | D+7.4 |
| Goliad | 3,377 | R+49.1 | R+60.2 | D+11.1 |
| Gonzales | 6,697 | R+34.3 | R+54.8 | D+20.5 |
| Grayson | 53,887 | R+41.4 | R+54.3 | D+12.9 |
| Grimes | 11,733 | R+46.7 | R+60.3 | D+13.5 |
| Guadalupe | 71,208 | R+10.0 | R+29.5 | D+19.5 |
| Harris | 1,383,128 | D+28.6 | D+5.5 | D+23.0 |
| Hays | 119,950 | D+26.9 | D+5.6 | D+21.3 |
| Hidalgo | 203,361 | D+42.0 | R+2.9 | D+44.9 |
| Hood | 30,330 | R+55.6 | R+66.0 | D+10.4 |
| Hunt | 37,612 | R+37.6 | R+55.5 | D+17.9 |
| Jack | 3,422 | R+68.9 | R+82.3 | D+13.4 |
| Johnson | 70,039 | R+30.7 | R+51.4 | D+20.8 |
| Kaufman | 62,342 | R+2.5 | R+27.9 | D+25.3 |
| Kendall | 26,159 | R+47.8 | R+55.7 | D+7.9 |
| Kenedy | 159 | R+17.6 | R+46.8 | D+29.2 |
| Kent | 377 | R+62.3 | R+76.4 | D+14.1 |
| King | 118 | R+86.4 | R+91.1 | D+4.7 |
| Kinney | 1,250 | R+32.5 | R+50.5 | D+18.0 |
| La Salle | 1,907 | D+5.9 | R+20.5 | D+26.4 |
| Lampasas | 9,201 | R+49.6 | R+59.6 | D+10.0 |
| Lee | 6,954 | R+46.5 | R+60.4 | D+13.9 |
| Liberty | 25,515 | R+30.4 | R+61.6 | D+31.2 |
| Llano | 11,696 | R+55.7 | R+60.9 | D+5.2 |
| Loving | 68 | R+69.1 | R+78.4 | D+9.2 |
| Lubbock | 104,417 | R+20.5 | R+39.5 | D+19.1 |
| Lynn | 2,124 | R+56.8 | R+70.3 | D+13.5 |
| Marion | 3,830 | R+45.1 | R+52.5 | D+7.5 |
| Mason | 2,166 | R+56.1 | R+65.0 | D+8.9 |
| Maverick | 12,934 | D+35.1 | R+18.5 | D+53.6 |
| McMullen | 381 | R+70.9 | R+84.4 | D+13.5 |
| Medina | 21,246 | R+25.4 | R+42.7 | D+17.3 |
| Montgomery | 258,819 | R+26.7 | R+45.5 | D+18.8 |
| Parker | 76,264 | R+54.0 | R+66.4 | D+12.4 |
| Presidio | 1,929 | D+53.9 | D+30.2 | D+23.7 |
| Real | 1,500 | R+60.9 | R+66.9 | D+6.0 |
| Reeves | 3,148 | R+3.8 | R+36.9 | D+33.1 |
| Roberts | 455 | R+89.2 | R+92.5 | D+3.2 |
| Robertson | 7,020 | R+37.7 | R+52.1 | D+14.4 |
| Rockwall | 53,642 | R+26.5 | R+40.9 | D+14.4 |
| Smith | 89,181 | R+29.0 | R+45.1 | D+16.1 |
| Somervell | 4,317 | R+60.3 | R+70.8 | D+10.5 |
| Tarrant | 729,141 | D+14.2 | R+5.1 | D+19.3 |
| Titus | 8,756 | R+28.0 | R+54.7 | D+26.7 |
| Travis | 548,591 | D+52.5 | D+39.3 | D+13.1 |
| Waller | 23,748 | R+5.5 | R+25.0 | D+19.5 |
| Washington | 15,536 | R+45.0 | R+54.7 | D+9.8 |
| Webb | 58,766 | D+39.6 | R+2.2 | D+41.8 |
| Williamson | 279,139 | D+13.7 | R+2.4 | D+16.2 |
| Wilson | 22,049 | R+40.2 | R+53.7 | D+13.5 |
| Wise | 31,032 | R+55.1 | R+70.0 | D+15.0 |
| Zavala | 3,121 | D+46.0 | D+14.4 | D+31.7 |
Questions and answers
How many counties did each party win in the Texas Senate race?
Democrats carry 24 counties and Republicans 55. 79 of 254 counties are fully counted so far.
Which counties moved most from 2024 in the Texas Senate race?
Maverick: 59.6 points toward Democrats; Webb: 49.5 points toward Democrats; Hidalgo: 49.3 points toward Democrats.
How many counties did each party win in the Texas governor's race?
Democrats carry 22 counties and Republicans 57. 79 of 254 counties are fully counted so far.
Which counties moved most from 2024 in the Texas governor's race?
Maverick: 53.6 points toward Democrats; Hidalgo: 44.9 points toward Democrats; Webb: 41.8 points toward Democrats.
Which Texas county cast the most votes?
Harris, with 1,383,128 votes counted; the margin there was D+28.6.
Texas 2026 results recap → · Download as CSV → · Swing from 2024 in every state →
County results: civicAPI. 2024: presidential votes by county (Harris vs. Trump). Margin: Democrat minus Republican, in points of the total.