




Presidential approval and the midterms
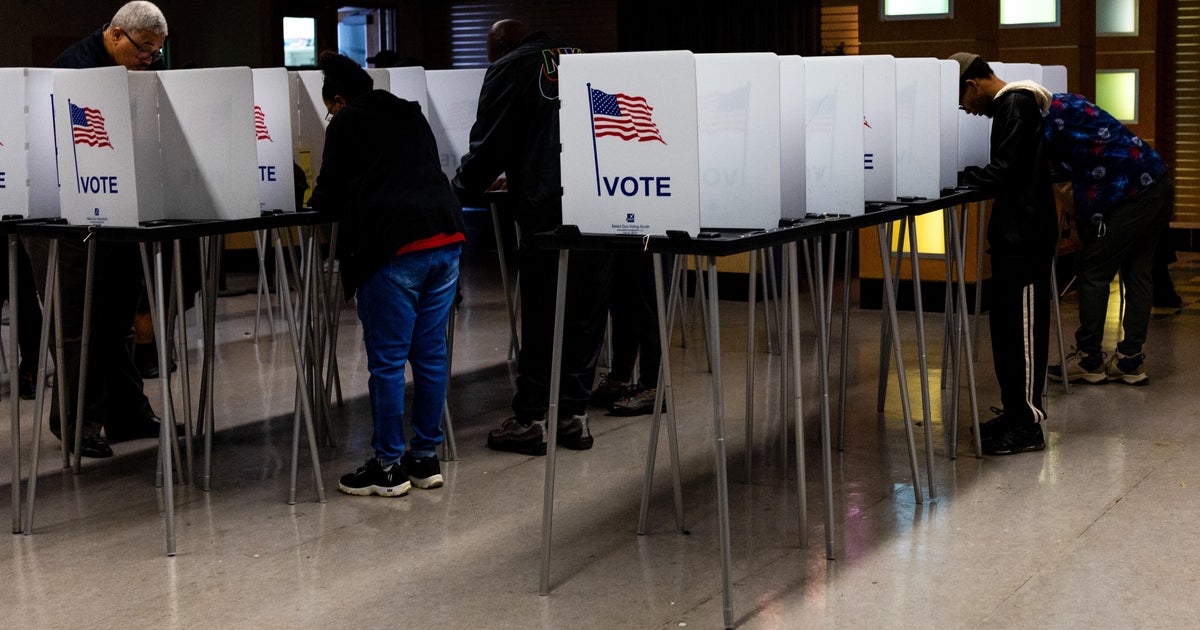
Since 1946, the president's party has lost House seats in 18 of 20 midterms. The less popular the president, the bigger the loss: at 50% approval or above, the party lost 15 seats on average (9 midterms); below 50%, it lost 35 (11 midterms).
| Year | President | Approval | House | Senate |
|---|---|---|---|---|
| 2022 | Joe Biden | 40% | -9 | +1 |
| 2018 | Donald Trump | 44% | -41 | +2 |
| 2014 | Barack Obama | 41% | -13 | -9 |
| 2010 | Barack Obama | 45% | -63 | -6 |
| 2006 | George W. Bush | 37% | -30 | -6 |
| 2002 | George W. Bush | 67% | +8 | +2 |
| 1998 | Bill Clinton | 65% | +4 | 0 |
| 1994 | Bill Clinton | 48% | -54 | -8 |
| 1990 | George H. W. Bush | 57% | -8 | -1 |
| 1986 | Ronald Reagan | 64% | -5 | -8 |
| 1982 | Ronald Reagan | 42% | -26 | +1 |
| 1978 | Jimmy Carter | 45% | -15 | -3 |
| 1974 | Gerald R. Ford | 53% | -48 | -5 |
| 1970 | Richard Nixon | 58% | -12 | +2 |
| 1966 | Lyndon B. Johnson | 44% | -47 | -4 |
| 1962 | John F. Kennedy | 61% | -4 | +3 |
| 1958 | Dwight D. Eisenhower | 57% | -48 | -13 |
| 1954 | Dwight D. Eisenhower | 62% | -18 | -1 |
| 1950 | Harry S. Truman | 41% | -28 | -6 |
| 1946 | Harry S. Truman | 27% | -56 | -12 |
The exceptions: in 1998 (Clinton, 65%) and 2002 (Bush, 67%), the president's party gained House seats. Both presidents had high approval. The midterms and the 2026 result → · Trump's approval today →
Source: The American Presidency Project (UC Santa Barbara), "Seats in Congress Gained/Lost by the President's Party in Mid-Term Elections", with Gallup approval; the last reading before each election is used. In 1974 the president was Gerald Ford, after Richard Nixon resigned.